Spectroscopy is a powerful tool in astronomy -- from it, we can often
get information about the temperature, density, composition, and
important physical processes of an
astronomical object. This information can help us answer the
questions:
Comets consist of almost pristine material from the early formation of
our solar system, unprocessed by harsh solar sunlight. Studying the
chemistry of these "dirty snowballs" gives us a clue as to the
composition and nature of our solar system in its infancy and
constrains theories of how life may have formed on Earth.
A link to radio-wavelength spectroscopy of comets may be found here.
Billions of years ago, when our galaxy took form, it is thought
that there must have been an epoch of rapid star-forming activity that
has since subsided. We can get clues to how this may have looked by
observing galaxies currently
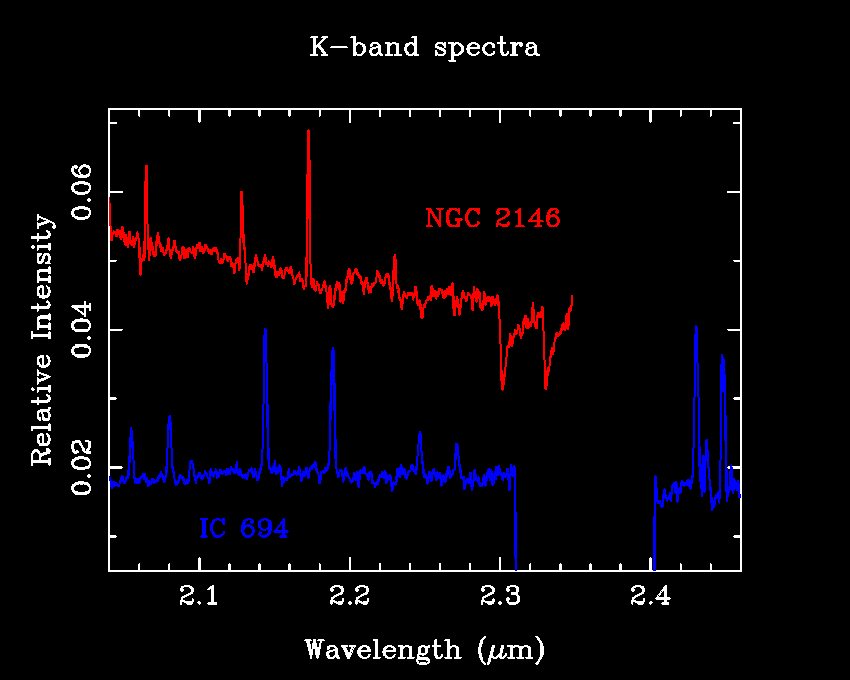
exhibiting violent, extreme star-formation. Such "starburst" galaxies
are studied best in the infrared and at radio wavelengths, since
star-forming galaxies
often harbor so much dust and gas that visible light cannot penetrate
to the centers where the majority of the star
formation is taking place. Below is an infrared (2.0 - 2.5 microns
wavelength, or 20,000 - 25,000 Angstroms) spectrum of two such
starburst galaxies. Most of the features you see are from molecular
hydrogen, H2, the stuff from which stars are made!
These molecular hydrogen emission lines
tell us that the molecular gas we see is very
warm; in the top galaxy, the gas is excited by shock-heated gas. The
bottom galaxy has molecular hydrogen excited by ultraviolet light
emitted from recently-formed young, hot stars.

The distant nature of quasars were discovered in the early 1960's,
when spectral lines were noted to be substantially-shifted
redder than they should normally be. This redshift can
be attributed to the recession (speeding away) of quasars from us. In
the standard Big Bang model of cosmology (the faster it's speeding
away from you, the more distant it is), this rapid motion implies that quasars
are the most distant objects known. Below is a typical spectrum of a
quasar. The wavelength scale has been rescaled to the "appropriate"
rest wavelengths for the spectral lines. The most noticeable feature
is the broad emission line at 1216 Angstroms due to hydrogen atoms
making the transition from the first excited state to the ground
state. Although 1216 Angstroms lies deep in the ultraviolet, where the
Earth's atmosphere is opaque, many quasars are receding from us so
fast, this line is redshifted into the visible part of the spectrum
(4000-7000 Angstroms).

Spectroscopy at Astronomy Camp is done with a spectrograph from
Optomechanics Research Inc, coupled with the Mount Lemmon 40" or
60" telescopes and the Camp's SBIG ST6 CCD detector array. With
relatively short exposure times, good quality spectra can be taken of
most catalogued stars and high surface-brightness deep-sky objects. A
few examples of Astronomy Campers' handiwork are shown below.
We combined four 5-minute exposures on the Ring Nebula using the 60"
and the ST6 camera. We subtracted an appropriate 5 minute dark frame from
each image and then combined the images using IRAF. The resulting ST6 image
follows: the dispersion (wavelength) axis is horizontal, and the spatial
axis (along the Ring Nebula) is vertical. The central lines are M57, the
upper and lower spikes are the calibration lamp spectra (Hg+He).

We make a 1-D spectrum from the 2-D image by summing over the aperture of the slit covering M57. Using the well-characterized wavelengths of the calibration lamps, we can use IRAF to register our spectrum to provide a nice wavelength scale. Here's what our spectrum looks like once plotted as intensity versus wavelength.

The brightest two lines at 4959 and 5007 Angstroms come from
twice-ionized oxygen (labeled O++, or O III in spectroscopic
notation). This means that two of oxygen's eight electrons have been
ripped away. This is a also clue that conditions in this nebula must be
harsh. In fact, these lines can only be excited to
emit light in temperatures of several thousand Kelvins and rather
thin densities of 1-100 atoms per cubic centimeter.
There is no continuous spectrum here -- this points out the important
fact that planetary nebulae are hot rarified gases -- you see a LINE
spectrum. This also points out how astronomers can get valuable
information about the physical conditions and important processes in
distant astronomical objects.
This spectrum also demonstrates why you can use light-pollution filters (like those made by Lumicon or Orion) to get great contrast from reflection/emission nebulae! These filters pass light waves that lie at wavelengths covered by these three lines, but block light at all other wavelengths. For nebulae, this is very beneficial since they only emit visible light in this wavelength range. You can remove all that ugly skyglow and light pollution without reducing the brighness of the nebula you're looking for.
Would such a narrow-band filter be good for looking at stars or galaxies? Hmm?
 In the cooler outer "atmosphere" around Sirius, mildly excited
hydrogen atoms in the 2nd energy level (the 1st excited state) are
'zapped' by photons (light waves) with just the right energy to send
them to even higher excited states. In this figure, we match the dark
absorption line that results from each transition upward in the
hydrogen atom. Notice that the higher-energy transitions on the left
result in higher energy absorption lines out in the ultraviolet. This
series of lines, starting from level 2, is called the Balmer series
after their discoverer.
In the cooler outer "atmosphere" around Sirius, mildly excited
hydrogen atoms in the 2nd energy level (the 1st excited state) are
'zapped' by photons (light waves) with just the right energy to send
them to even higher excited states. In this figure, we match the dark
absorption line that results from each transition upward in the
hydrogen atom. Notice that the higher-energy transitions on the left
result in higher energy absorption lines out in the ultraviolet. This
series of lines, starting from level 2, is called the Balmer series
after their discoverer.
Stars are classified by their temperatures, which can be determined by the star's spectral features. The hottest stars are termed O-stars, the next cooler are B stars, then A, F, G, K, and finally M-stars. Sirius is a relatively hot A-type star at about 10,000 degrees Kelvin. Such stars have the strongest hydrogen-features (simply due to temperature -- cooler stars can't 'zap' the hydrogen atoms as effectively, and hotter stars will destroy/ionize the hydrogen atoms that create the spectral lines!).
Molecules in Cool Stars! On the other end of the scale -- here is Delta Virgo; a cool M3-type giant star at about 3,500 K and viewed at about 6000 Angstroms (in red light). Note a bright continuum at far left, which suddenly dims into a series of striations (bands). These don't look like the sharp absorption lines of the hydrogen atom, do they? In fact, these bands are due to MOLECULES that can live in the atmospheres of these cool stars! This particular molecule is TiO (titanium oxide). Molecules have a dizzying number of lines because they not only have the electron energy levels like atoms, but also have energy sublevels due to the rotation and vibration of the molecule! At the modest resolution of our spectrometer, these hundreds of lines are blended into absorption bands like what we see here.


Stars like our Sun Somewhere between hotter A-type stars and cool M-class stars are stars like our sun, around 5500 degrees Kelvin. Here's Beta-Bootes, a G8 giant star (roughly what our sun will be when it begins dying in about 5 billion years). The first spectrum is at 5500 Angstroms (yellow light), just like the M-star spectrum above. Notice that molecules don't form here (it's too hot for molecules to readily form without being quickly destroyed), but there are still an awful lot of lines around. Most of these features are due to heavy elements -- things like carbon (in several ionization stages), iron, oxygen, magnesium, calcium etc.

This is a spectrum of the same star, but now taken at 4000 Angstroms (deep blue-violet light). The deep absorption lines at left are due to the ion Calcium II (the difference between this and normal, neutral calcium is that one electron has been stripped off here). The small dip in the middle is due to a blend of metallic features and hydrogen. Notice that the hydrogen lines are very weak here -- nothing at all like Sirius (a hotter A-class star).

- What is it?
- What is it like?
- What is it made out of?
- How did it get there? What will happen to it?
- Does it give us clues as to how WE got here?
Molecular Spectroscopy and Comets
A link to radio-wavelength spectroscopy of comets may be found here.
Probing the Formation of Stars in Colliding Galaxies
Uncovering the mystery of Quasars
Spectroscopy at Astronomy Camp!
Planetary Nebulae, Or 'Why Light Pollution Filters Work'!
 |
Here's an image of M57 (a.k.a. the Ring Nebula), with a crude representation of the spectrometer slit superimposed. This image is a 180 second exposure using the Camp's ST6 CCD on a 10" Meade Schmidt-Cassagrain telescope. Astronomy Camp's spectrograph was mounted on the Mount Lemmon 60" telescope with the same ST6 CCD. The slit length is about 8 arcminutes long and 1 arcsecond wide; the representation of the slit width in the diagram is exaggerated. |
We make a 1-D spectrum from the 2-D image by summing over the aperture of the slit covering M57. Using the well-characterized wavelengths of the calibration lamps, we can use IRAF to register our spectrum to provide a nice wavelength scale. Here's what our spectrum looks like once plotted as intensity versus wavelength.
 |
The emission line at 4861 Angstroms comes from hot, excited atomic hydrogen. Highly-excited hydrogen atoms in M57's gaseous shell, starting in energy level 4, may eventually de-excite to level 2, giving up the energy difference in waves of light at that particular energy (and... they have a wavelength of 4861 Angstroms!). |
This spectrum also demonstrates why you can use light-pollution filters (like those made by Lumicon or Orion) to get great contrast from reflection/emission nebulae! These filters pass light waves that lie at wavelengths covered by these three lines, but block light at all other wavelengths. For nebulae, this is very beneficial since they only emit visible light in this wavelength range. You can remove all that ugly skyglow and light pollution without reducing the brighness of the nebula you're looking for.
Would such a narrow-band filter be good for looking at stars or galaxies? Hmm?
Stellar Spectroscopy
A look at Sirius Now, onto stellar spectroscopy. This 1/2 second exposure of Sirius is centered near 4000 Angstroms (blue, near-ultraviolet) and clearly shows a series of deep absorption lines. These lines are due to the hydrogen atom. Let's explore how.
In the cooler outer "atmosphere" around Sirius, mildly excited
hydrogen atoms in the 2nd energy level (the 1st excited state) are
'zapped' by photons (light waves) with just the right energy to send
them to even higher excited states. In this figure, we match the dark
absorption line that results from each transition upward in the
hydrogen atom. Notice that the higher-energy transitions on the left
result in higher energy absorption lines out in the ultraviolet. This
series of lines, starting from level 2, is called the Balmer series
after their discoverer.
Stars are classified by their temperatures, which can be determined by the star's spectral features. The hottest stars are termed O-stars, the next cooler are B stars, then A, F, G, K, and finally M-stars. Sirius is a relatively hot A-type star at about 10,000 degrees Kelvin. Such stars have the strongest hydrogen-features (simply due to temperature -- cooler stars can't 'zap' the hydrogen atoms as effectively, and hotter stars will destroy/ionize the hydrogen atoms that create the spectral lines!).
Molecules in Cool Stars! On the other end of the scale -- here is Delta Virgo; a cool M3-type giant star at about 3,500 K and viewed at about 6000 Angstroms (in red light). Note a bright continuum at far left, which suddenly dims into a series of striations (bands). These don't look like the sharp absorption lines of the hydrogen atom, do they? In fact, these bands are due to MOLECULES that can live in the atmospheres of these cool stars! This particular molecule is TiO (titanium oxide). Molecules have a dizzying number of lines because they not only have the electron energy levels like atoms, but also have energy sublevels due to the rotation and vibration of the molecule! At the modest resolution of our spectrometer, these hundreds of lines are blended into absorption bands like what we see here.
Stars like our Sun Somewhere between hotter A-type stars and cool M-class stars are stars like our sun, around 5500 degrees Kelvin. Here's Beta-Bootes, a G8 giant star (roughly what our sun will be when it begins dying in about 5 billion years). The first spectrum is at 5500 Angstroms (yellow light), just like the M-star spectrum above. Notice that molecules don't form here (it's too hot for molecules to readily form without being quickly destroyed), but there are still an awful lot of lines around. Most of these features are due to heavy elements -- things like carbon (in several ionization stages), iron, oxygen, magnesium, calcium etc.
This is a spectrum of the same star, but now taken at 4000 Angstroms (deep blue-violet light). The deep absorption lines at left are due to the ion Calcium II (the difference between this and normal, neutral calcium is that one electron has been stripped off here). The small dip in the middle is due to a blend of metallic features and hydrogen. Notice that the hydrogen lines are very weak here -- nothing at all like Sirius (a hotter A-class star).


No comments:
Post a Comment